This is very easy to do using Excel (of course). The result of this test is a number between 0 and 1 that represents the probability that the differences between two sets of data are due to random error - this number is the p value. Thus a t test that gives the number 0.6 means that there is a 60% chance that the differences in the two sets of data are due to random errors. A value of .01 means there is a 1% chance that the differences are due to random error. Statisticians have decreed that any value from a t test that is < 0.05 (less than 5%) indicates that the difference of the means of the two samples sets is not due to random errors and they are statistically different. This is important to remember. There is a more complete discussion of the t test in the lab manual for Biol 1406 and one can always use the internet to
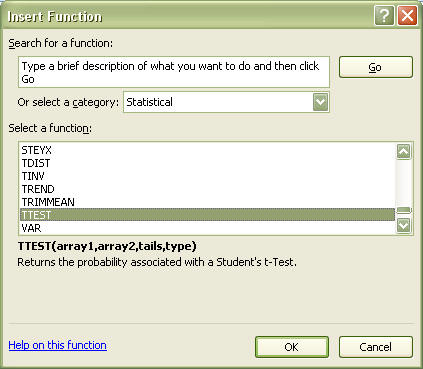
Highlight a cell (you will need to somehow label the cell, however, it is not really important which cell you use, as long as it does not interfere with you data input), select the FORMULAs tab. Select INSERT FUNCTION from the choices. This will bring up a dialog box with two windows. Select STATISTICAL in the top box. The lower box will now be filled with various statistical functions. Scroll the window and select T-TEST as shown below.
This will start another dialog box with four data windows. To perform the t test, you must identify two sets of data that you are comparing, these are called ARRAY 1 and ARRAY2 in Excel. To start, you want to compare the values of Column A with those of Column B. Click your cursor in the first date window which is named ARRAY1. Now select the data in column A (if you have 20 data points, you should have 20 cells selected). Do the same with ARRAY 2 but select the data in column B. Be sure NOT to select either the average or standard deviation cells.
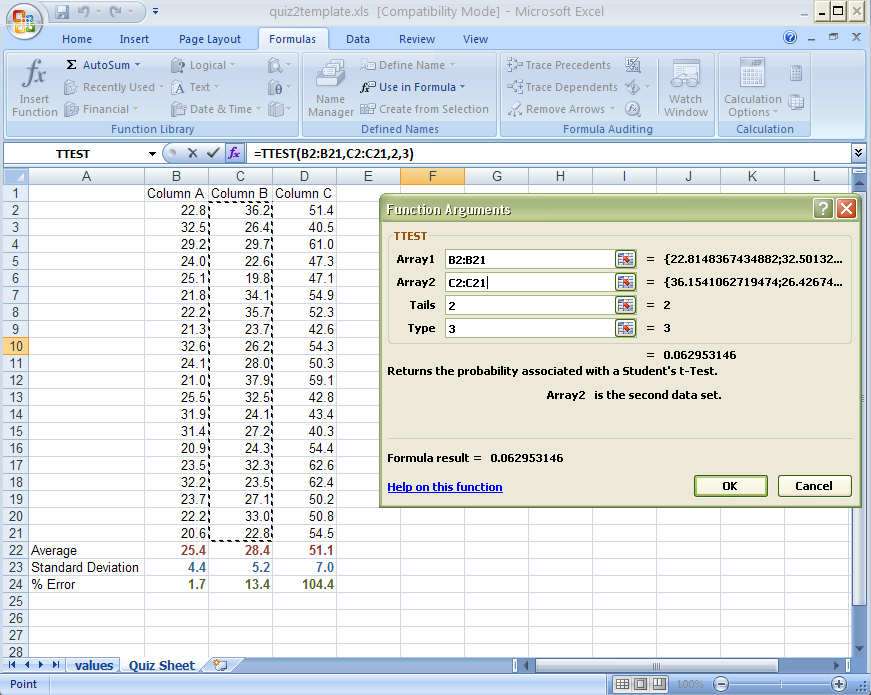
In the TAILS window, place the number 2 and in the TYPE window, place the number 3 - for this course, always use these values. Now press OK.
The number that now appears in the cell with the function is the p value which is the % probability that the differences between these two sets of data are due to random error (and thus are NOT different from each other statistically). As stated above, scientists will generally consider data sets to be different if the % chance that they are due to random error is less than 5%. So if you do a T TEST and the p value comes out at 15%, then there is a 15% probability that the differences in data sets are due to random error and thus they not considered to be statistically different. If the p value was .025 (or 2.5%), then they are considered to be statistically different (and it is reported as < 0.05). Format this cell so that it is colored and so that there are just 2 decimal places. Place some sort of label to identify the data.
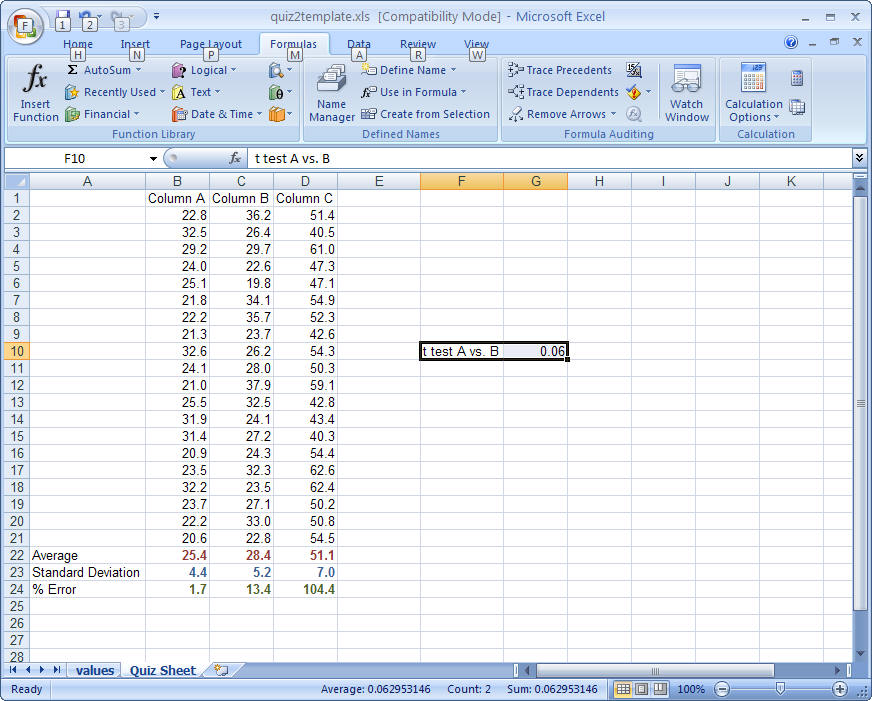
In this example, the t test value is 0.06. Since this value is greater than 0.05, we would cannot exclude the possibility that the differences of these two sets of data due to random error and thus one should conclude that the data are not statistically different. Remember that your values may be different.
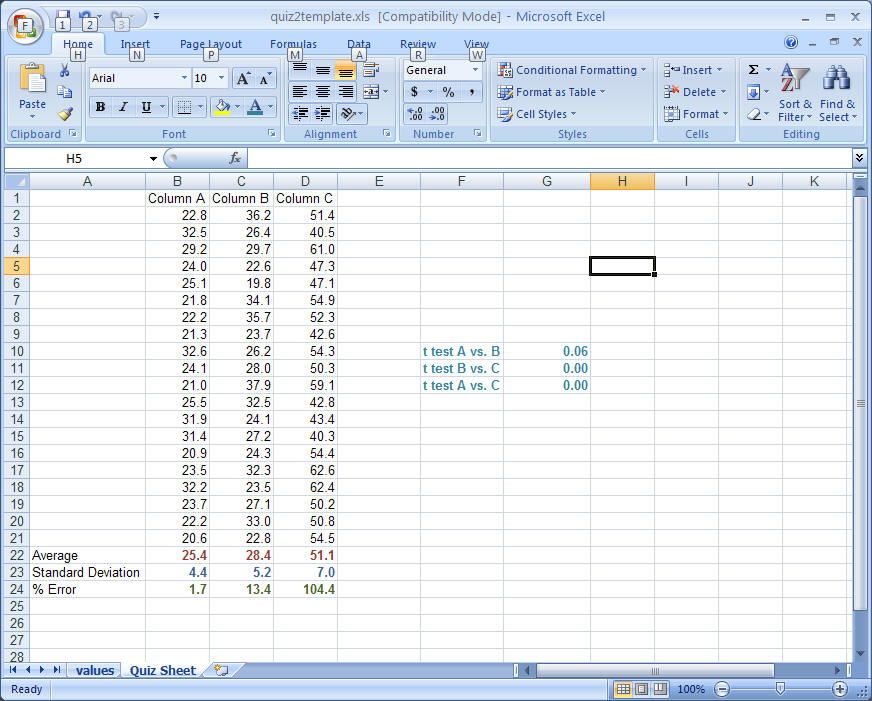
Do the same and compare column A with C and compare B with C. You will then need to indicate which sets of data are significantly different. This can be typed into any free cell. Thus you are making three different comparisons (A-B, B-C, and A-C). You should then indicate whether the data are or are not significantly different.
Save the file and email it to me.
Return to Homepage