BIOL 1406
PreLab 1.10
How do I use a hand-held calculator to
determine the mean, percent error of the mean, and standard deviation of a
random variable?
|
 |
Uncertainty, or experimental error, is always involved when
making a measurement. If two people independently took several measurements of a
physical quantity such as the weight of an object, it is unlikely that both
would come up with exactly the same results every time. Perhaps the instrument
used to make the measurements is out of calibration or is influenced by
variations in temperature and line voltage. Or perhaps the instrument can’t
discriminate well between two very similar values. Or maybe personal error,
carelessness, or bias is involved. For reasons like these, measurements are
never perfect; they are only approximations of some true value that is being
measured.
The accuracy of a measurement refers to how close
the measured values come to the true value. In other words, it is a measure of
the correctness of the result. The precision of a measurement refers to
how variable the measured values are when the same quantity is measured several
times. A very precise measurement would be one that did not vary much over
several trials, although it may or may not be accurate. In this section we will
examine three statistics that scientists commonly use to evaluate the accuracy
and precision of their measurements.
|
|
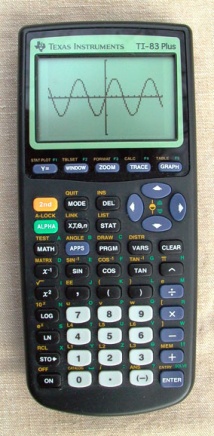
Graphing Calculator |
 |
Mean
The mean is a statistic that is used to express the
“average” or “center” of a set of numbers. When the same quantity is measured
several times, the mean of the replicated measurements is a more precise measure
of the quantity than any of the individual measurements.
You should have a scientific calculator that automatically
calculates the mean for a list of numbers. Use the instructions that came with
your calculator to learn how to calculate the mean. If you no longer have the
instructions, you can use the instructions in Appendix B of this Manual,
provided you are using the TI-36X. If you are using a different calculator, it
is fairly easy to find instructions for most calculators on the Internet (check
the manufacturer’s Web site or do a Google search). If you are still having
problems, get help from one of the math tutors located in the Tutoring Labs at
any ACC campus.
|
Percent Error of
the Mean – used to express accuracy
Accuracy refers to how close a series of
measurements are to the true or target value. It is often expressed in terms of
the percent error of the mean. In general, the closer the measurements
are to the true or target value, the lower the percent error of the mean, and
the better the accuracy of the measurements. The percent error of the mean is
calculated using the following formula:
|
Percent error of mean =
[│calculated
mean – true or target value
│ ∕ true or target value ] x 100 |
In the formula above, the notation
│number│
means “the absolute value of the number.” The absolute value refers to the
numerical value of a number without regard to sign. Thus, 7 is the absolute
value of both +7 and -7.
For example, suppose you want to know if you have a
realistic sense of how long one minute is. You check your sense of time by
saying “start” and “stop” while a lab partner measures the actual time that
passes with a stop watch. Here are your results: 45 sec, 52 sec, 50 sec, 47
sec, and 53 sec. The mean number of seconds that you thought was one minute is
49 sec (note that the calculated mean cannot have more decimal places than
the original measurements.) The target value is 60 sec. Using the formula
for calculating percent error of the mean:
[│49
- 60│ sec ∕
60 sec ] x 100 = 18%
So, in this case your sense of the length of one minute is
18% inaccurate.
|
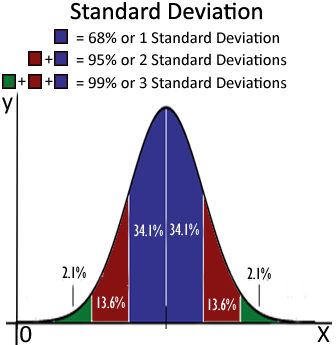 |
Standard
Deviation – used to express precision
Precision refers to how close replicate measurements are to
each other. It is often expressed in terms of the standard deviation.
In general, the less variation there is among the values, the lower the standard
deviation, and the better the precision of the measurements.
Use the instructions that came with your calculator to
learn how to calculate standard deviation. If you no longer have the
instructions, you can use the instructions in Appendix B of this Manual,
provided you are using the TI-36X. If you are using a different calculator, you
can find instructions for most calculators on the Internet (check the
manufacturer’s Web site or do a Google search). If you are still having
problems, get help from one of the math tutors located in the Tutoring Labs at
any ACC campus.
|
How can I determine
how accurately a given volume of water has been measured?
Pure water has a density of 1.00 g/mL at room temperature.
Therefore, we can easily convert a given volume of water into its corresponding
weight and vice versa. For example, 5 mL of deionized water weighs 5g, and 5g
of water has a volume of 5 mL. Because weight can be easily measured to the
nearest 0.01g on the electronic balances in lab, the weight of a given volume of
water can be used to check how accurately a the volume was measured to the
nearest 0.01 mL.
|
Your Turn |
|
|
NOTE: Make sure you use the
correct units and the correct number of significant digits in all of your
answers below.
A student uses a 100 mL beaker to
measure 80.0 mL of deionized water (dH2O). She then weighs the
water with an electronic balance. Following this procedure 6 times, she
obtains the following results: 82.89 g, 80.23 g, 81.27 g, 81.92 g, 82.03 g,
and 80.17 g.
-
Enter the mean volume of water delivered by the
100 mL beaker in the space provided.
-
Enter the percent error of the mean for the
volumes of water delivered by the beaker.
-
Enter the standard deviation
(σx n – 1)
for the volumes of water delivered by the beaker.
|
|
Check your answers:
-
Mean
(= 81.42 mL)
-
% error
(= 1.78%)
-
Standard Deviation
(= 1.08 mL)
|
|
|
During the second part of her experiment, the student
repeats her measurements using a 100 mL graduated cylinder instead of a
beaker. This time she obtains the following results: 80.79 g, 79.33 g,
80.25 g, 79.82 g, 80.13 g, and 80.19 g.
-
Enter the mean
volume of water delivered by the 100 mL graduated cylinder in the
space provided.
-
Enter the percent error of the mean for the volumes of
water delivered by the graduated cylinder.
-
Enter the standard deviation (σx
n – 1) for the volumes of water delivered by the graduated cylinder.
|
|
Check your answers:
-
Mean
(= 80.09 mL)
-
% error
(= 0.1%)
-
Standard
Deviation
(= 0.49 mL)
|
|
Which measuring device seems to
be more accurate? Explain your answer.
(Check your answer.)
(Recall that percent error of the mean measures accuracy. The closer the measured values are to the desired value, the smaller the percent error of the mean, and the greater the accuracy of the measurements. In this case, the percent error for the beaker is 1.78% while that of the cylinder is 0.1%. Therefore, the results indicate that the 100 mL cylinder is more accurate for measuring 80 mL of water.) |
| Which measuring device seems to be
more precise? Explain your answer.
(Check your answer.)
(Recall that standard deviation measures precision. A smaller SD indicates less variation among the measurements and, therefore, greater consistency or precision. In this case, the SD for the beaker is 1.08 mL while that of the cylinder is 0.49 mL. Therefore, the results indicate that the 100 mL cylinder is more precise for measuring 80 mL of water.) |
Notice the number of significant
digits in the percent error answers. Because the target value (80.00 mL) is
not a measured value it does not affect the number of significant digits in
the answer. Therefore, the number of signification digits is determined
entirely by the numbers in the numerator of the percent error calculation:
- For the beaker, the numerator calculation was 81.42 g - 80.00 g = 1.42 g.
This number has 3 significant digits and so the percent error has 3 significant
digit.
- For the cylinder, the numerator calculation was 80.09 g - 80.00 g = 0.09
g. This number has only 1 significant digit, so the percent error has only 1
significant digit.
|
Close this browser window to return
to Blackboard and complete the practice quiz and assessment quiz.