BIOL 1406
PreLab 1.11
What is the Student’s t-test?
In the previous
section, when comparing measurements made using a beaker and graduated cylinder,
we asked, “Which measuring device seems to be more accurate?” Why did we use
the weasel-word “seems”? If one measuring device has a smaller percent error of
the mean than another, can’t we say it is more accurate? Unfortunately, the
answer is no. To help understand why, imagine that the same student repeated
her experiment, only this time instead of using a beaker for the first set of
measurements and a graduated cylinder for the second set, she used a single
graduated cylinder for both sets of measurements. In this case, would you
expect to find exactly the same percent error of the mean for both sets of
measurements? Although this is possible, it is extremely unlikely. In fact, if
the experiment were repeated many times, chances are that sometimes the first
set of measurements would have the lower percent error of the mean and sometimes
the second set would. In each experiment, the two sets of measurements, taken
with the same graduated cylinder, probably would have different percent errors
of the mean because of chance, not because the graduated cylinder is actually
becoming more or less accurate from one trial to the next.
 |
As another
example, let’s say you toss a coin 100 times and get 59 “heads”. Next, you toss
the same coin 100 more times and during the second trial you get only 49
“heads”. Why did you get a different result the second time? One possibility
is that the difference was simply caused by chance. |
|
Heads and Tails |
So, let’s
consider the experiment from the previous section where we measured 80 mL of dH2O
using a beaker and a graduated cylinder. If the mean volume measured by the
beaker were 82.83 mL and the mean volume measured by the graduated cylinder were
80.13 mL, how would we know if the graduated cylinder is closer to the target
value because it is more accurate, or if the difference between the two means
was simply caused by chance? Unfortunately, there is no way to be sure! No
matter how large the difference between the 2 means is, there is no way we can
rule out the possibility that it was caused by chance alone. However, what we
can say is that the larger the difference between the means, the less likely it
was caused by chance alone. In fact, scientists can use statistical tests to
determine the probability that we would get a difference as large or larger than
the one we observed by chance alone. This probability is called the p value.
|
 |
The Student’s
t-test is a statistical test that can be used to test the null hypothesis that
the difference between 2 means was caused by chance alone. By convention, if
the p value is greater than 0.05 we conclude that the difference between the 2
means is NOT significant (i.e. there is a relatively high probability that it
was caused by chance alone.) On the other hand, if the p value is less than
0.01 we conclude that the difference between the 2 mean is highly significant
(i.e. there is a very low probability that it was caused by chance alone.) A p
value between 0.01 and 0.05 is considered a borderline region, the difference is
considered significant but not highly significant. In this case we would
probably want to collect more data before we make a conclusion. |
|
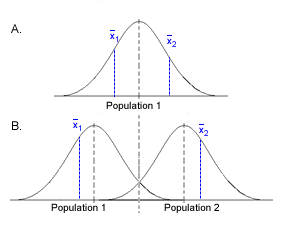
The t-test is used to decide if 2 data sets come
from the same population (Figure A) or from 2 different populations (Figure B).
|
|
IMPORTANT
In science, when we accept a
hypothesis, this does NOT mean we have decided that the hypothesis is
correct or that it is probably correct. It simply means that we do
not have convincing evidence to show that the hypothesis is wrong.
(Just like in our legal system where we assume someone is innocent until
proven guilty, in science we accept our hypothesis until we have
convincing evidence to show it is false.) |
|
Example
For example, let’s say we want to test the null
hypothesis that when measuring 190
μL
of water, there is no difference in the accuracy of the 20 – 200
μL automatic pipettor and the 100
– 1000 μL automatic pipettor. We
measure out 190 μL of water 8
times with each instrument and weigh each sample. The mean weight of the
water delivered by the 20 – 200
μL
automatic pipettor is 0.19 g and the mean weight of water delivered by the
20 – 200 μL automatic pipettor is
0.20 g. The Student’s t-test gives a p value of 0.32. Because
p > 0.05 we conclude that the difference in means is not significant.
Therefore, we accept our hypothesis that the 2 pipettors are equally
accurate. However, this does not mean that we have decided that the 2
pipettors are equally accurate; it simply means that our experiment did
not provide sufficient evidence to conclude that they aren’t equally
accurate. Of course, it is quite possible that if we repeated our
experiment using more trials or using a more accurate scale (one that
could read to the nearest 0.001 g or the nearest 0.0001 g) we would find
sufficient evidence to show that one pipettor is more accurate than the
other. |
Close this browser window to return
to Blackboard and complete the practice quiz and assessment quiz.

