BIOL 1406
PreLab 2.9
How can I use trendlines and linear
regression to analyze the relationship between 2 experimental variables?
After a scatter diagram has been prepared, the relationship
between 2 variables can sometimes be seen more clearly if we draw a simple line
graph by connecting the points on the scatter diagram. However, a line graph
generally includes apparent irregularities in the relationship that may actually
be due to error and/or chance variations that occur when you collected your
data. For this reason, rather then connect the points, it is often more
useful to determine the straight line or smooth curve that can
best be drawn as close as possible to the points on the scatter diagram. This
is referred to as the best fit line or trendline. If the trendline
is straight, rather than curved, then the relationship between the 2 variables
is described as linear.
|
 |
In this course you will often be asked to determine the
“best fit” straight line for a set of data points. Many calculators have
statistics programs that can determine how well a set of data points fit a
straight line. These programs can also determine the equation of the “best fit”
straight line. This type of analysis is called linear regression analysis.
Linear regression is an extremely powerful technique because the equation of the
best fit straight line (also called the linear regression line) indicates
the exact mathematical relationship between the 2 variables. This means that if
you know the value of one variable, you can use the linear regression equation
to calculate the value of the other variable. In the following discussion we will describe some general
principles of linear regression. Detailed instructions on how to use the TI-36X
calculator to carry out linear regression can be found in Appendix B at
the back of this manual. If you are using a different calculator, refer to the
instructions that came with your calculator or check for instructions on the
Web. |
|
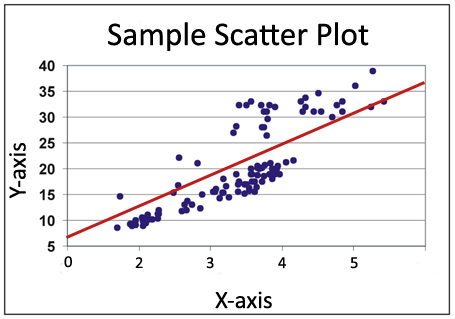
Scatter plot with linear regression line
shown in red |
|
Examine the table and scatter diagram of protein concentrations vs. A280
shown below. Try to visualize the smooth line that would most closely
match the 9 data points. Notice that this line would have a steeper slope at
low protein concentrations (up to about 320 μg/mL), but would gradually “flatten
out” as you move towards higher protein concentrations. This is because once
all or most of the UV light at 280 nm has been absorbed, further increasing the
protein concentration of the solution will not produce any additional increase
in absorbance.
Actually, this is a fairly typical result when comparing
two variables in a biological experiment. Often there is a linear (i.e. straight
line) relationship between the variables when the independent variable has low
and/or moderate values. But this relationship may “break down” as we approach
extremely high (or in some cases extremely low) values of the independent
variable, causing the “best fit” line to either “flatten out” or “steepen”.
Therefore, although we could try to fit a straight line to all of the data
points on our scatter diagram, we should look for signs that the linear
relationship is “breaking down” at extreme ends of the data range. When using
linear regression analysis, you should also keep in mind that a minimum of 5
data points are needed to get reliable results. In our example, because the
curve seems to “flatten out” with the last two data points, most scientists
would try to fit a straight line to the first 7 data points only. Most likely,
it is only in this region where a true linear relationship exists.
|
|
Table 2.1 Absorbance of UV light by protein solutions |
Scatter Plot of Data in Table 2.1 |
|
Protein Concentration (μg/mL) |
A280 |
 |
| 0 |
0.000 |
| 10 |
0.045 |
| 20 |
0.098 |
| 40 |
0.195 |
| 80 |
0.373 |
| 160 |
0.711 |
| 320 |
1.398 |
| 640 |
1.833 |
| 1280 |
1.999 |
You can use your calculator to determine how well a set of
points actually fit a straight line by calculating the linear correlation
coefficient, usually designated by the letter “r”. The value of “r” ranges
from +1 to -1. A positive correlation coefficient means that as one variable
increases, the other also increases. A negative correlation coefficient means
that as one variable increases, the other decreases. If the linear correlation
coefficient is close to +1 or -1 this indicates that the data fit a straight
line very well. If the correlation coefficient is close to zero (either
positive or negative) then the data do not fit a straight line well. In
general, most scientists will conclude that 2 variables are linearly related if
the absolute value of the linear correlation coefficient is greater than 0.95.
You can also use your calculator to determine the equation
of the straight line that best fits your data. The general equation for a
straight line can be written as:
|
y = mx + b
where m is the slope of the line
(how steep or flat the line is)
and b is the y-intercept
(the value of y when the
line crosses the y axis) |
A positive slope means the value of y increases as
the value of x increases (positive correlation), and a negative slope
means the value of y decreases as the value of x increases (negative
correlation.) To determine the equation of the straight line that best fits
your data, use your calculator to determine the slope and y-intercept of the
“best fit” straight line, and then substitute these values into the equation
above. The resulting equation indicates the precise mathematical relationship
between the 2 variables you are studying, within the region where they are
linearly related.
The equation of the best fit straight line indicates the
exact mathematical relationship between the 2 variables you are studying. In
our example, the variables are protein concentration (x) and A280 values (y).
This means that if you know the value of one variable (either x or y), you can
substitute that value into the linear regression equation and calculate the
value of the other variable. [Note: With the TI-36X, you can simply enter the
value of one variable into the calculator, press two buttons, and the calculator
will display the value of the other variable. See Appendix B for detailed
instructions.] This allows you to determine the coordinates (x and y values) of
any point that lies on the linear regression line. In addition, if you wish to
plot the linear regression line on your scatter diagram, simply determine the
coordinates of any two points on the line, plot the points on the scatter
diagram, and then draw the straight line that runs through the two points. When
doing this, it is best to plot two points that are near the two extremes of the
region where your data suggest a linear relationship exists.
 IMPORTANT: If you know the value of one variable, you can use
the linear regression equation to determine the value of the other variable ONLY
when the value of the variables lies within the data range that was used to
calculate the linear regression equation. In our example, the linear regression
equation was calculated using data points where protein concentration varied
from 0 to 320 μg/mL, and A280 values varied from 0 to 1.398. Therefore, you
should NOT use this equation to determine the A280 value of a solution that has
a protein concentration greater than 320 μg/mL. Likewise, you should NOT use
this equation to determine the protein concentration of a solution that has an
A280 value greater than 1.398. IMPORTANT: If you know the value of one variable, you can use
the linear regression equation to determine the value of the other variable ONLY
when the value of the variables lies within the data range that was used to
calculate the linear regression equation. In our example, the linear regression
equation was calculated using data points where protein concentration varied
from 0 to 320 μg/mL, and A280 values varied from 0 to 1.398. Therefore, you
should NOT use this equation to determine the A280 value of a solution that has
a protein concentration greater than 320 μg/mL. Likewise, you should NOT use
this equation to determine the protein concentration of a solution that has an
A280 value greater than 1.398. |
Close this browser window to return
to Blackboard and complete the practice quiz and assessment quiz.