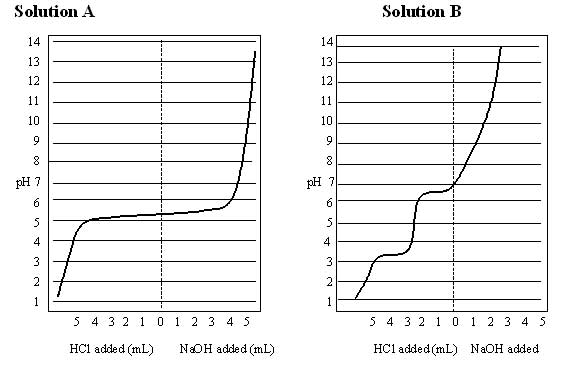
To plot an acid-base titration curve, first draw the 2 axes of your graph. You
should place the volume of acid or base added to the unknown solution (your
independent variable) on the x-axis, and place the pH of the unknown solution
(your dependent variable) on the y-axis. Plotting of the x-axis is slightly
different compared to previous graphs we have made. In this case, the zero
point should be placed in the MIDDLE of the x axis, and the volume of base added
should increase as you move to the right of the zero point while the volume of
acid added should increase as you move to the left of the zero point. A simple
way to do this with a graphing program such as Excel is to use positive values
to represent the volume of base added (e.g. let 10, 20, and 30 represent 10, 20, and
30 mLs of base added) and use negative numbers to represent the volume of acid
added (e.g. let -10, -20, and -30 represent 10, 20, and 30 mLs of acid added.) If you
use this approach, make sure it is clearly indicated on your graph.
After you have labeled the axes of your graph, plot the data points and draw a
smooth curve as close as possible to all of the points. The resulting plot is
referred to as a titration curve. The titration curve serves to profile the
unknown solution. The shape of the curve reveals much chemistry including
information about the buffering range and buffering capacity of your unknown
solution. |
 |