Before separating the whey proteins with column
chromatography, how can I predict which column fraction will have the highest
concentration of α-lactalbumin?
You will be collecting 14 one-mL fractions from your chromatography column. How
can you determine which fraction will contain the highest concentration of
α-lactalbumin?
First, you must calibrate your column using protein standards to make a standard
curve. The equation of the standard curve will tell you the exact relationship
between the elution volume, or Ve, of any molecule and its molecular weight. The
elution volume is the volume of liquid that has already passed
through the column as the highest concentration of the molecule of interest
comes out. Therefore, if the Ve for a molecule is calculated to be 12.3 mL, and
you collect one-mL fractions, then your thirteenth fraction should contain the
highest concentration of your molecule.
Void volume
Void volume or Vo is the volume of buffer present between the beads of a column.
The void volume for the column you will use is 7.0 mL. In a column that has a
void volume of 7.0 mL, proteins that are large enough to pass around all of the
gel beads as they travel through the column will elute from the bottom once 7.0
mL of buffer has passed through the column.
Column calibration
We know that size exclusion chromatography separates proteins according to size.
However, in order to predict which column fraction will contain the highest
concentration of a protein of known size, the column must be calibrated. To
calibrate your column, 4 proteins of known size (called protein standards) were
passed through the column, 2 at a time, and then 1 mL fractions were collected
from the bottom of the column. Note that these four proteins were not chosen
because they occur in milk, but because they are inexpensive, readily available
for purchase, and they span the size range that includes
α-lactalbumin (14,437
daltons):
Protein Standards
Molecular Weight (daltons)
Bovine serum albumin (BSA)
Carbonic anhydrase
Cytochrome c
Aprotinin
66,000
29,000
12,400
6,500
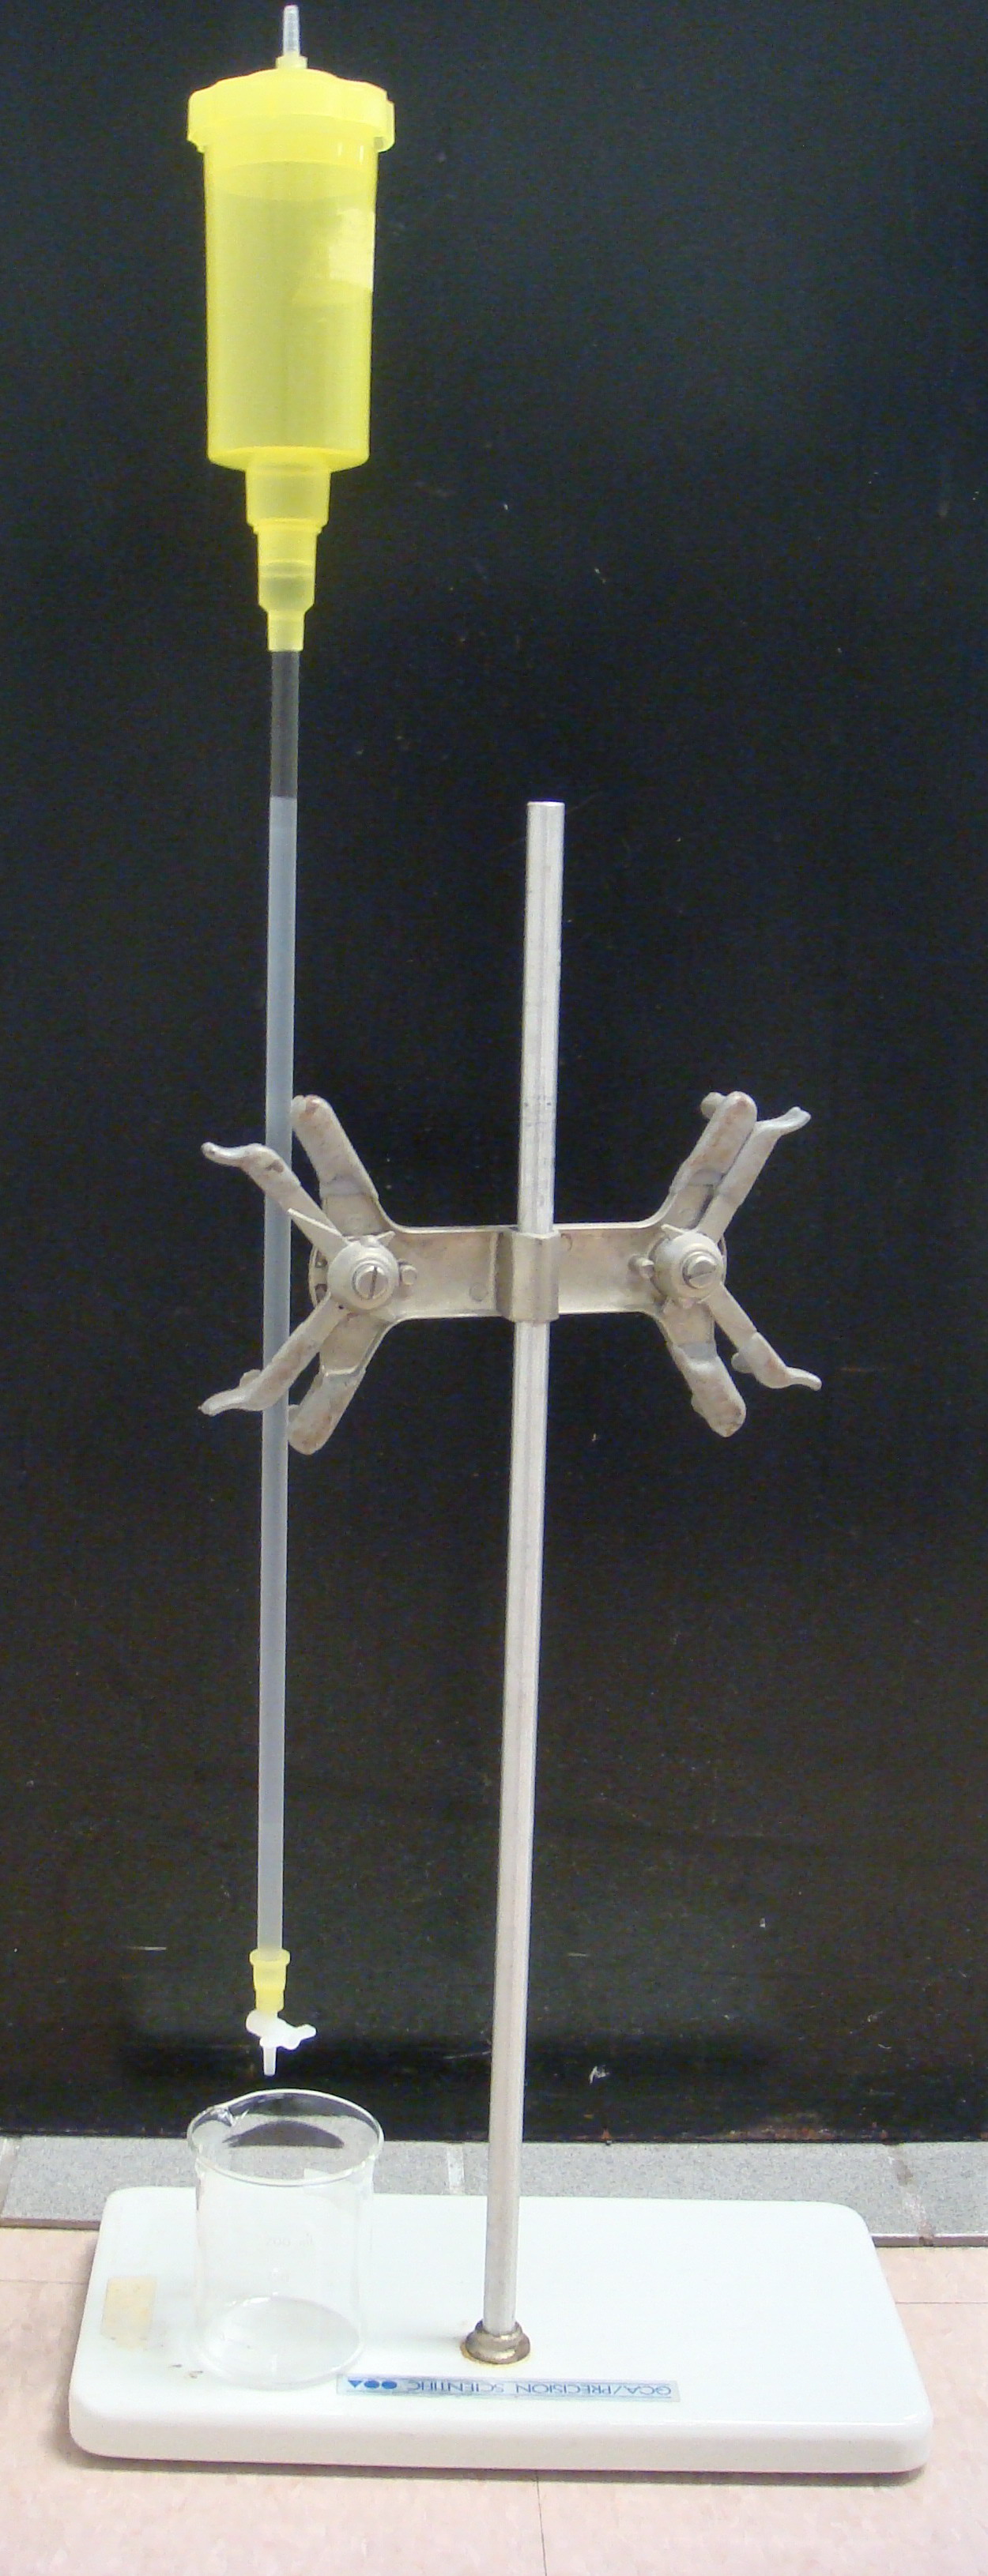
Size exclusion chromatography column
In order to compare the concentrations of protein in the fractions that were
collected, absorbance of the fractions at 280nm (A280) was measured with a
spectrophotometer. In general, the higher the protein concentration, the higher
the A280 value will be. Although this is not a very accurate method for
measuring protein concentration, it is a quick and easy way to compare the
protein concentration and is adequate for our purpose.
Study the table below and identify the two peaks in absorbance. Be
careful, the 2 peaks are not necessarily the 2 highest readings. In order
to have a "peak", both the reading immediately before and the reading
immediately after the peak must be lower than the reading at the peak itself.
First run:
Aprotinin (6,500 daltons) and Carbonic Anhydrase (29,000 daltons)
Fraction
1-5
6
7
8
9
10
11
12
13
14
A280
(discarded)
0.420
0.489
0.619
0.559
0.489
0.503
0.550
0.508
0.501
Your Turn
Using the information from the table above,
answer the following questions:
During the first run, which protein came out first?
Now, examine the results for the second calibration run and identify the 2 peaks
in absorbance. Remember, the 2 peaks are not necessarily the 2 highest
readings. In order to have a "peak", both the reading before and the
reading after the peak must be lower than the reading at the peak itself.
Second run:
Cytochrome C (12,400 daltons ) and BSA (66,000 daltons)
Fraction
1-4
5
6
7
8
9
10
11
12
A280
(discarded)
0.412
0.463
0.878
0.539
0.603
0.665
0.526
0.463
Your Turn
Using the information from the table above,
answer the following questions:
During the second run, which protein came out first?
By determining when several proteins of known size elute from our size exclusion
column, we can estimate when proteins of any size will elute from the same
column. This is done by plotting a standard curve, which shows the relationship
between the size of a protein and its elution volume.
In the following table, fill in the name, molecular weight, and elution volume (Ve)
of the four protein standards that were used to calibrate your size exclusion
column (leave the last 2 columns in the table blank for now):
Take a careful look at the data in your table. You want to use this information
to determine the relationship between the size (MW) of a protein and its elution
volume (Ve.) In a general sense, you should see that as size (MW) increases, the
Ve decreases. But you want something more precise. A standard curve will tell
you the exact mathematical relationship between these 2 variables. Once you know
the equation for your standard curve, you can substitute the MW of any protein
into the equation and solve for its Ve.
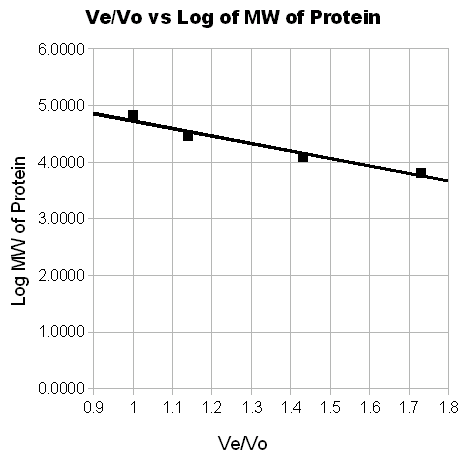
Unfortunately, the relationship between the MW of a protein and its Ve is not
linear. This means that if you prepare a scatter diagram by plotting the
molecular weight of the standards on the y-axis, and the Ve of the standards on
the x-axis, the points will form a curved rather than a straight line. However,
if you plot the log of MW instead of MW on the y-axis, you will get a linear
relationship (i.e. a straight line). Because it is easier to determine the
equation of a straight line than a curved line, you will use log of MW instead
of MW when constructing your standard curve.
Fill in the log of MW for each protein standard in the table above.
Another problem is that the Ve of a protein depends not only on its MW but also
on the size of the column it is run through. Obviously, the same protein will
have a larger Ve when it is traveling through a long column and a smaller Ve
when it is traveling through a short column. To neutralize the effect of
different column sizes, you have to divide the Ve of each protein by the Vo for
the column (Vo is the amount of liquid in between the gel beads, so is a measure
of column size.) Actually, this is only necessary when the protein standards are
run through a column that has a different size than the column used for the
unknown proteins, but it is a good habit to get into. Using Ve/Vo during column
chromatography is similar to using Rf values (rather than migration distances)
during thin layer chromatography (see Lab Exercise 7).
Given that the V0 for the column is 7.0 mL, fill in the Ve/Vo for each protein
standard in the table above.
Next, using a sheet of graph paper or a computer with spreadsheet program, plot a
scatter diagram showing the relationship between log of MW and Ve/Vo for the 4
protein standards in the table. Make sure you plot log MW on the y-axis and Ve/Vo
on the x-axis.Mouse over to check your graph.
Now, using a hand-held calculator or a computer with spreadsheet program, carry
out linear regression to determine the equation of the “best fit” straight line
for your data points. This is the equation of the standard curve for your
column. (Note: If you use a hand-held calculator, do not erase the data in
memory until you have answered all of the questions below.)
Your Turn
Using the information from the table above,
answer the following questions:
Write the equation of the standard curve for your size exclusion column in the
space below:
In this equation, “y” represents log of MW and “x” represents Ve/Vo. This
equation can be used to determine the elution volume (Ve) of any protein,
provided you know the MW of the protein, and the MW lies within the size range
of the protein standards used to make the standard curve (in this case, between
6,500 daltons and 66,000 daltons.)
Substitute the value of “log of MW for
α-lactalbumin” into your linear regression equation for “y” and calculate the value of “x”. The value of “x” equals Ve/Vo.
(On the TI-36 you can do this by entering the y-value (log MW of
α-lactalbumin)
into the calculator, then press [2nd] and [x']. If you have cleared your
calculator before doing this step, you will need to re-enter your data.)
Based on your calculation, what is Ve/Vo for
α-lactalbumin?
Remember, the Ve for a protein is the volume of liquid, in milliliters, that has
already passed through the column as the highest concentration of the protein of
interest comes out. Since you will be collecting 1.0 mL fractions, a Ve between
0 and 1 mL means the highest concentration of the protein will be found in the
first fraction, a Ve between 1 and 2 mL means the highest concentration of the
protein will be found in the second fraction, a Ve between 2 and 3 mL means the
highest concentration of the protein will be found in the third fraction, etc.
In which fraction do you expect to find the highest concentration of
α-lactalbumin? Since you will need this information during lab, write the fraction number in
the following space and in your lab notebook: