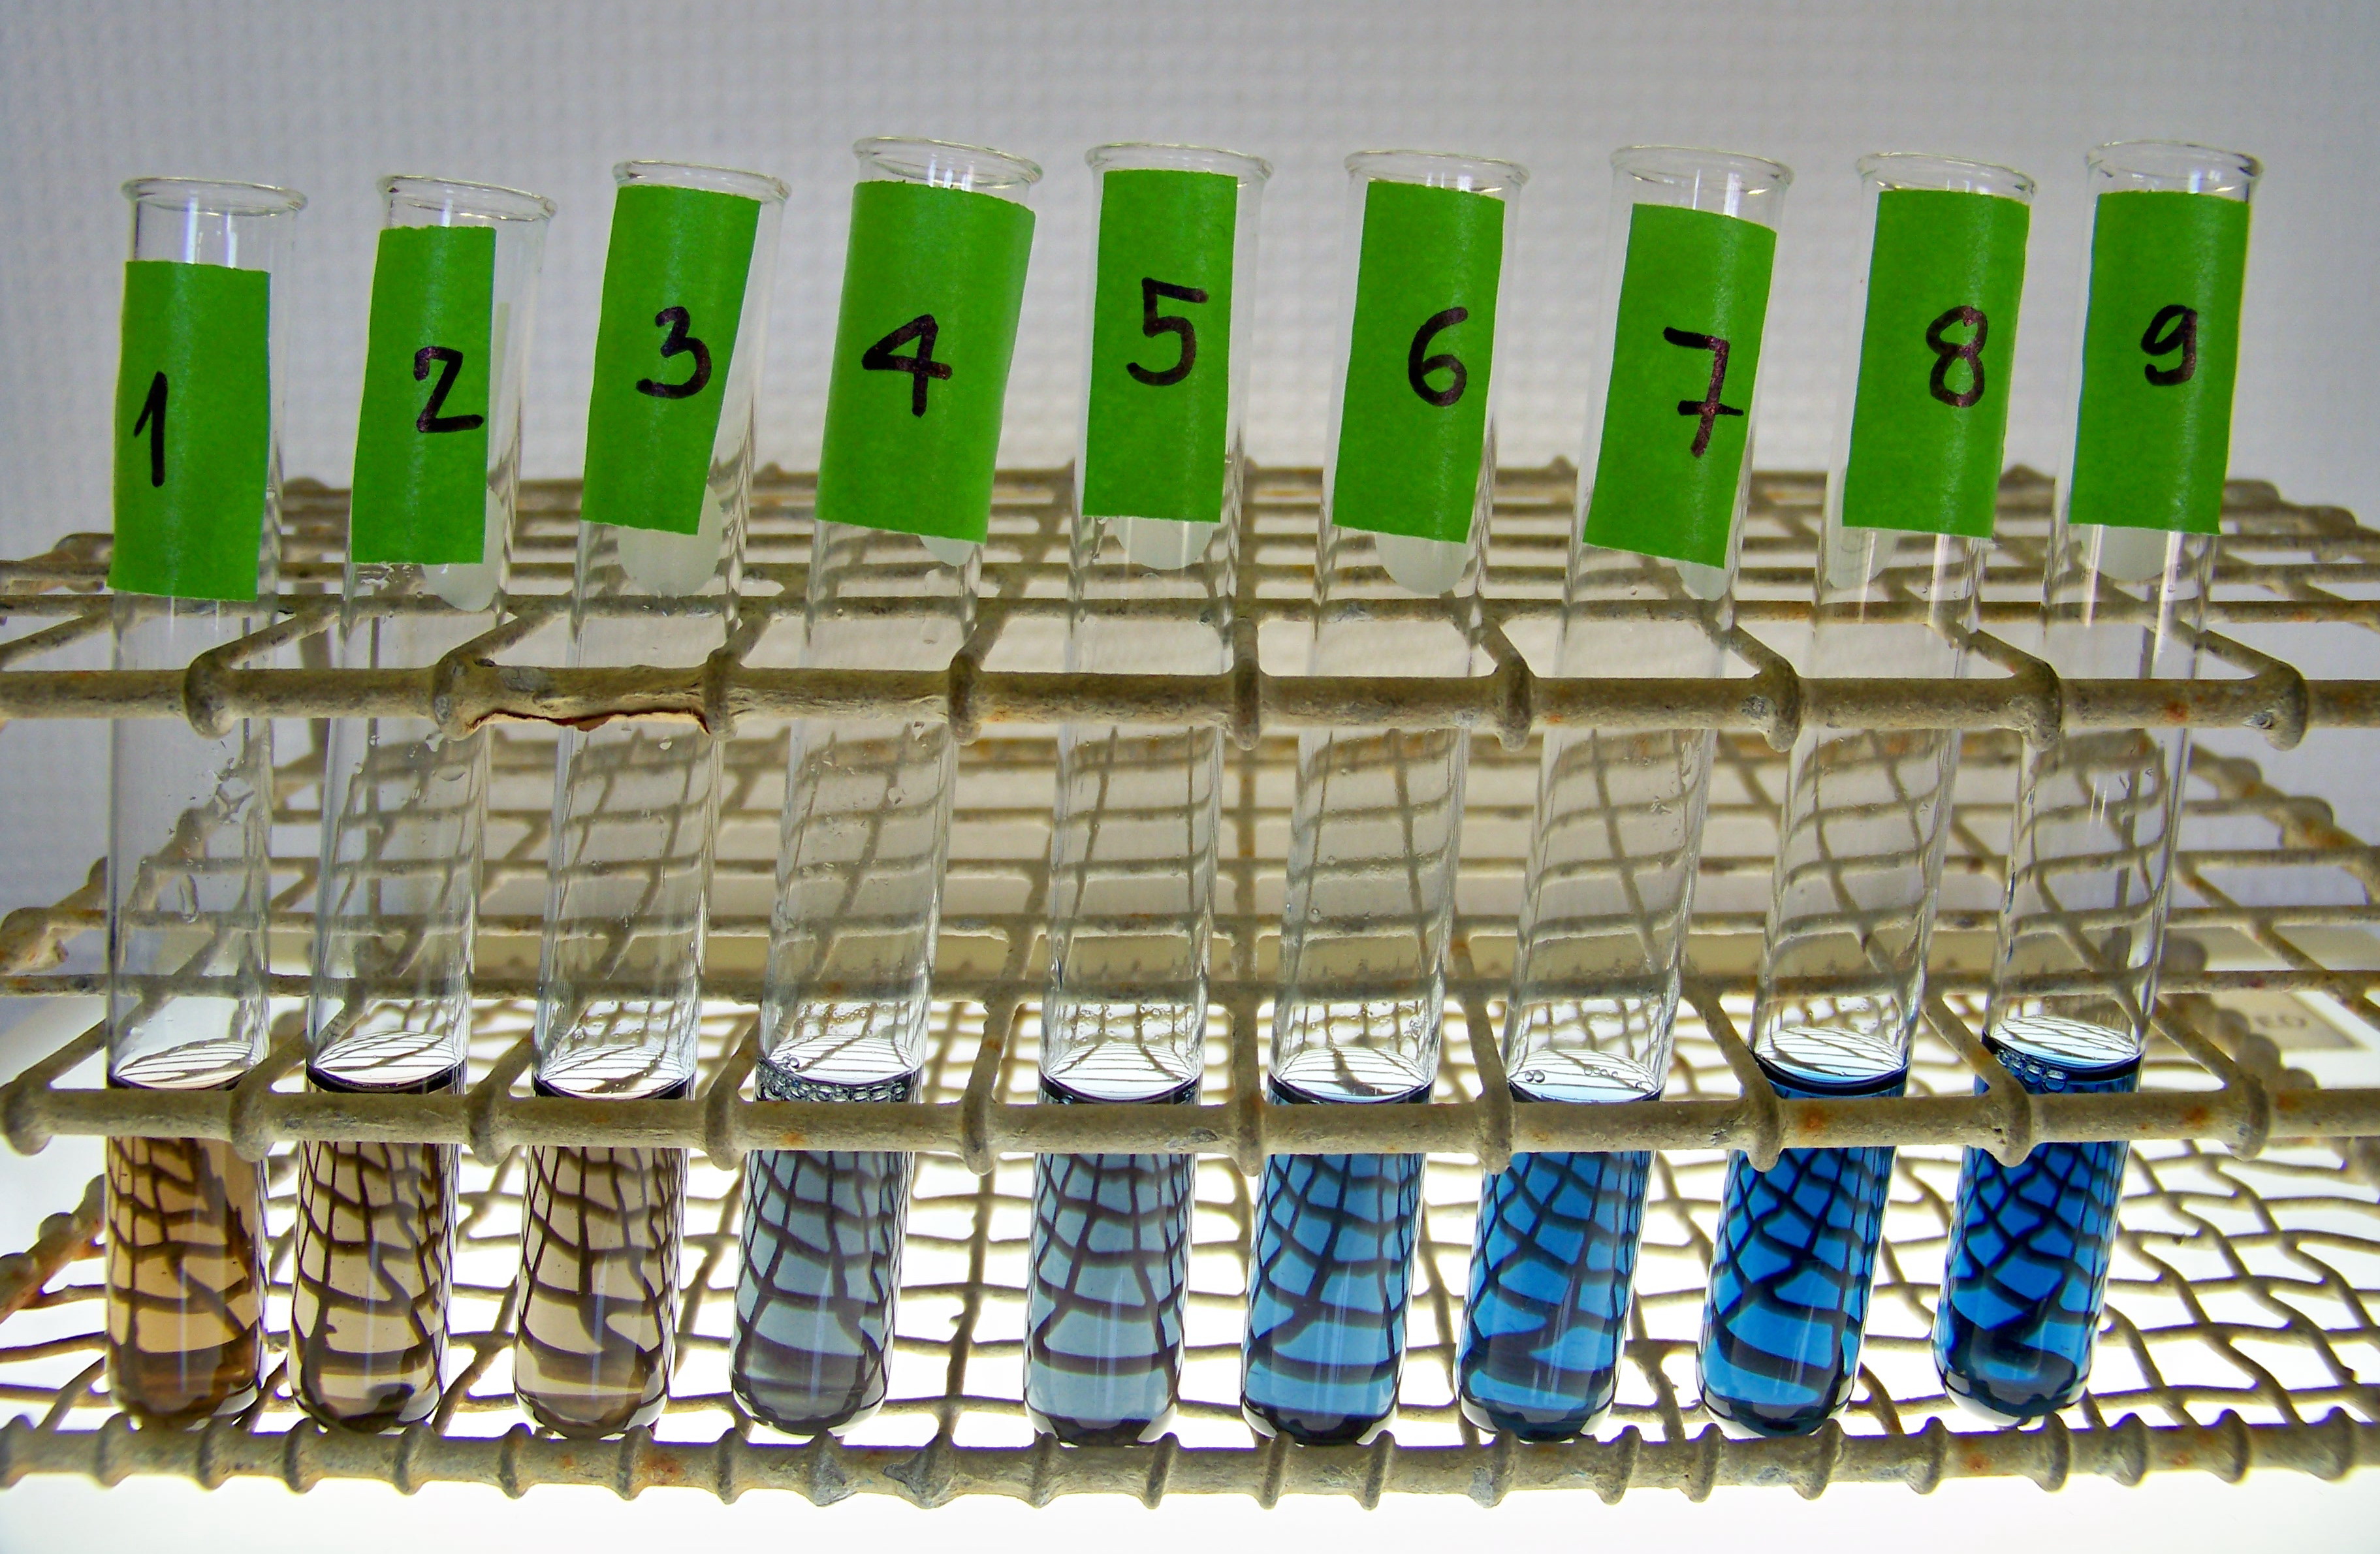
BSA samples used to prepare a standard curve for the Bradford's assay
BIOL 1406
PreLab 8b.1
How can I determine the protein concentration of the 8 milk
fractions that I collected during the purification of
α-lactalbumin?
Last week, you used several techniques in an attempt to separate
α-lactalbumin
from the other molecules found in nonfat milk. At several points during the
procedure, you saved samples of the milk fractions. These fractions will be
analyzed using SDS-PAGE electrophoresis in order to assess the effectiveness of
the various purification steps. Electrophoresis will separate the various
proteins present in each milk fraction, allowing you to determine the number of
proteins present and their molecular weights. Knowledge of molecular weights can
then be used to help identify the various proteins present in each fraction.
Before you run gel electrophoresis, however, you must decide how much of each
sample should be loaded onto the electrophoresis gel. This is important in order
to avoid loading too much or too little protein onto the gel. The amount of
sample needed will depend on the protein concentration of each sample.
Therefore, your job today will be to estimate the total protein concentration of
each milk fraction that you collected last week.
A protein assay is a test that is used to detect the presence of protein. A
qualitative assay simply indicates whether protein is present in your sample.
Some qualitative assays will detect any protein, while others are designed to
detect a specific protein. A quantitative assay, on the other hand, is used to
determine how much protein is present. A quantitative assay may be used to
measure the concentration of protein in a solution (e.g. in mg/mL), or, in the
case of an enzyme, the assay may be designed to measure the level of enzyme
activity. During protein purification, it is useful to have a quantitative assay
to determine how much protein is present after each step of the purification
process. This allows scientists to monitor the concentration and/or activity of
the protein as it is being purified.
In today’s lab, you will determine the concentration of protein in each of the 8
milk fractions that you prepared during Lab 8A:
There are several methods for determining the concentration of protein in a solution. One method, which was mentioned in Prelab 8a.3, is absorbance of light at 280 nm (A280). This assay has the advantage of being quick and easy; you simply place the sample in a spectrophotometer and read the absorbance. In addition, this method is nondestructive, so it does not use up any of the sample that is being analyzed. Unfortunately, this assay is not very accurate because it depends on the concentration of amino acids with rings in their R-groups, and different proteins have different amounts of those amino acids.
| The biuret and Lowry assays are both based on the binding of copper ions (Cu2+)
to the nitrogen atoms present at the peptide bonds of proteins. This reaction
causes the protein solution to turn purple (biuret) or blue (Lowry). The color
intensity is proportional to the concentration of protein in the sample. The
color intensity is measured using a spectrophotometer, and the results are
compared to a standard curve prepared using known concentrations of a purified
protein standard. Each of these assays has advantages and disadvantages. The
biuret assay is the most reliable assay for protein because other substances
present in the solution rarely interfere with the accuracy of the results.
Unfortunately, it takes about 20-30 minutes for the color to develop, so it
isn’t nearly as fast as the A280 assay, and it can only detect relatively high
concentrations of protein (1 mg/mL or more.) The Lowry assay, in which a second
reagent is added to the biuret reagent, is much more sensitive and can be used
to measure protein concentrations as low as 5 μg/mL. However, the Lowry assay
takes even longer to complete, requiring 40-60 minutes for the color to develop.
Reliability is another disadvantage of the Lowry assay because other substances
in the solution can greatly affect its accuracy. |
|
|
BSA samples used to prepare a standard curve for the Bradford's assay |
The Bradford assay is the most commonly used protein assay because of its
accuracy, sensitivity, and convenience. The Bradford assay is much more accurate
than A280 measurements, few other substances interfere with its accuracy, it is
sensitive to protein concentrations as low as 1 μg/mL, and it is very rapid,
producing a color change within five minutes. The Bradford assay is based on the
binding of Coomassie Blue dye to proteins. The dye alone has a brownish color
and absorbs light most efficiently at 465 nm. When the dye combines with protein,
however, the resulting protein-dye complex has an intense blue color whose
maximum absorption is at 595 nm.
In today’s lab, you will use the Bradford assay to determine the protein
concentration of the 8 milk fractions you saved last week. In order to
determine the protein concentration of these milk fractions, you will need to
prepare a standard curve that shows the exact relationship between the A595
value of each fraction and its protein concentration.
 To prepare a standard curve for the Bradford assay, first prepare a series of
solutions of known protein concentration using bovine serum albumin (BSA), a
protein commonly used as a protein standard. Next, add Bradford’s Reagent
(containing Coomassie Blue dye) to the BSA solutions and measure the A595 value
of each solution. Next, prepare a scatter diagram of your data by plotting
protein concentration of the BSA solutions on the x-axis and A595 values on the
y-axis. Now, use linear regression to determine the equation of the best-fit
straight line for your data points. This equation is the equation of your
standard curve; it shows the exact relationship between protein concentration
and the A595 value of a solution.
To prepare a standard curve for the Bradford assay, first prepare a series of
solutions of known protein concentration using bovine serum albumin (BSA), a
protein commonly used as a protein standard. Next, add Bradford’s Reagent
(containing Coomassie Blue dye) to the BSA solutions and measure the A595 value
of each solution. Next, prepare a scatter diagram of your data by plotting
protein concentration of the BSA solutions on the x-axis and A595 values on the
y-axis. Now, use linear regression to determine the equation of the best-fit
straight line for your data points. This equation is the equation of your
standard curve; it shows the exact relationship between protein concentration
and the A595 value of a solution.
Once you have the linear regression equation for your standard curve, you can
use the Bradford assay to determine the protein concentrations of the 8 milk
fractions you prepared last week. First, dilute the 8 milk fractions so their
A595values will lie within the range of your standard curve. Next, add
Bradford’s Reagent to each diluted milk fraction and measure its A595 value.
Now, substitute these A595values into your linear regression equation for “y”
and calculate the corresponding values for “x”. The “x” values equal the protein
concentrations of the diluted milk fractions. Finally, calculate the protein
concentrations of the undiluted milk fractions.
| Your Turn | |
| Why is it necessary to determine the protein concentration of the 8 milk
fractions that you collected during the purification of
α-lactalbumin?
|
Check your answer. |
| Describe the difference between a qualitative protein assay
and a quantitative protein assay.
|
Check your answer. |
| What are the main advantages of the Bradford protein assay
compared to the A280, biuret and Lowry assays?
|
Check your answer. |
| How do you prepare a standard curve for the Bradford assay?
|
Check your answer. |
| You wish to determine the protein concentration of an
unknown solution. You add Bradford’s reagent to the solution and, after 5 minutes, measure an A595
value of 0.136. How can you determine the protein concentration of the solution
from its A595 value?
|
Check your answer. |
Close this browser window to return
to Blackboard and complete the practice quiz and assessment quiz.