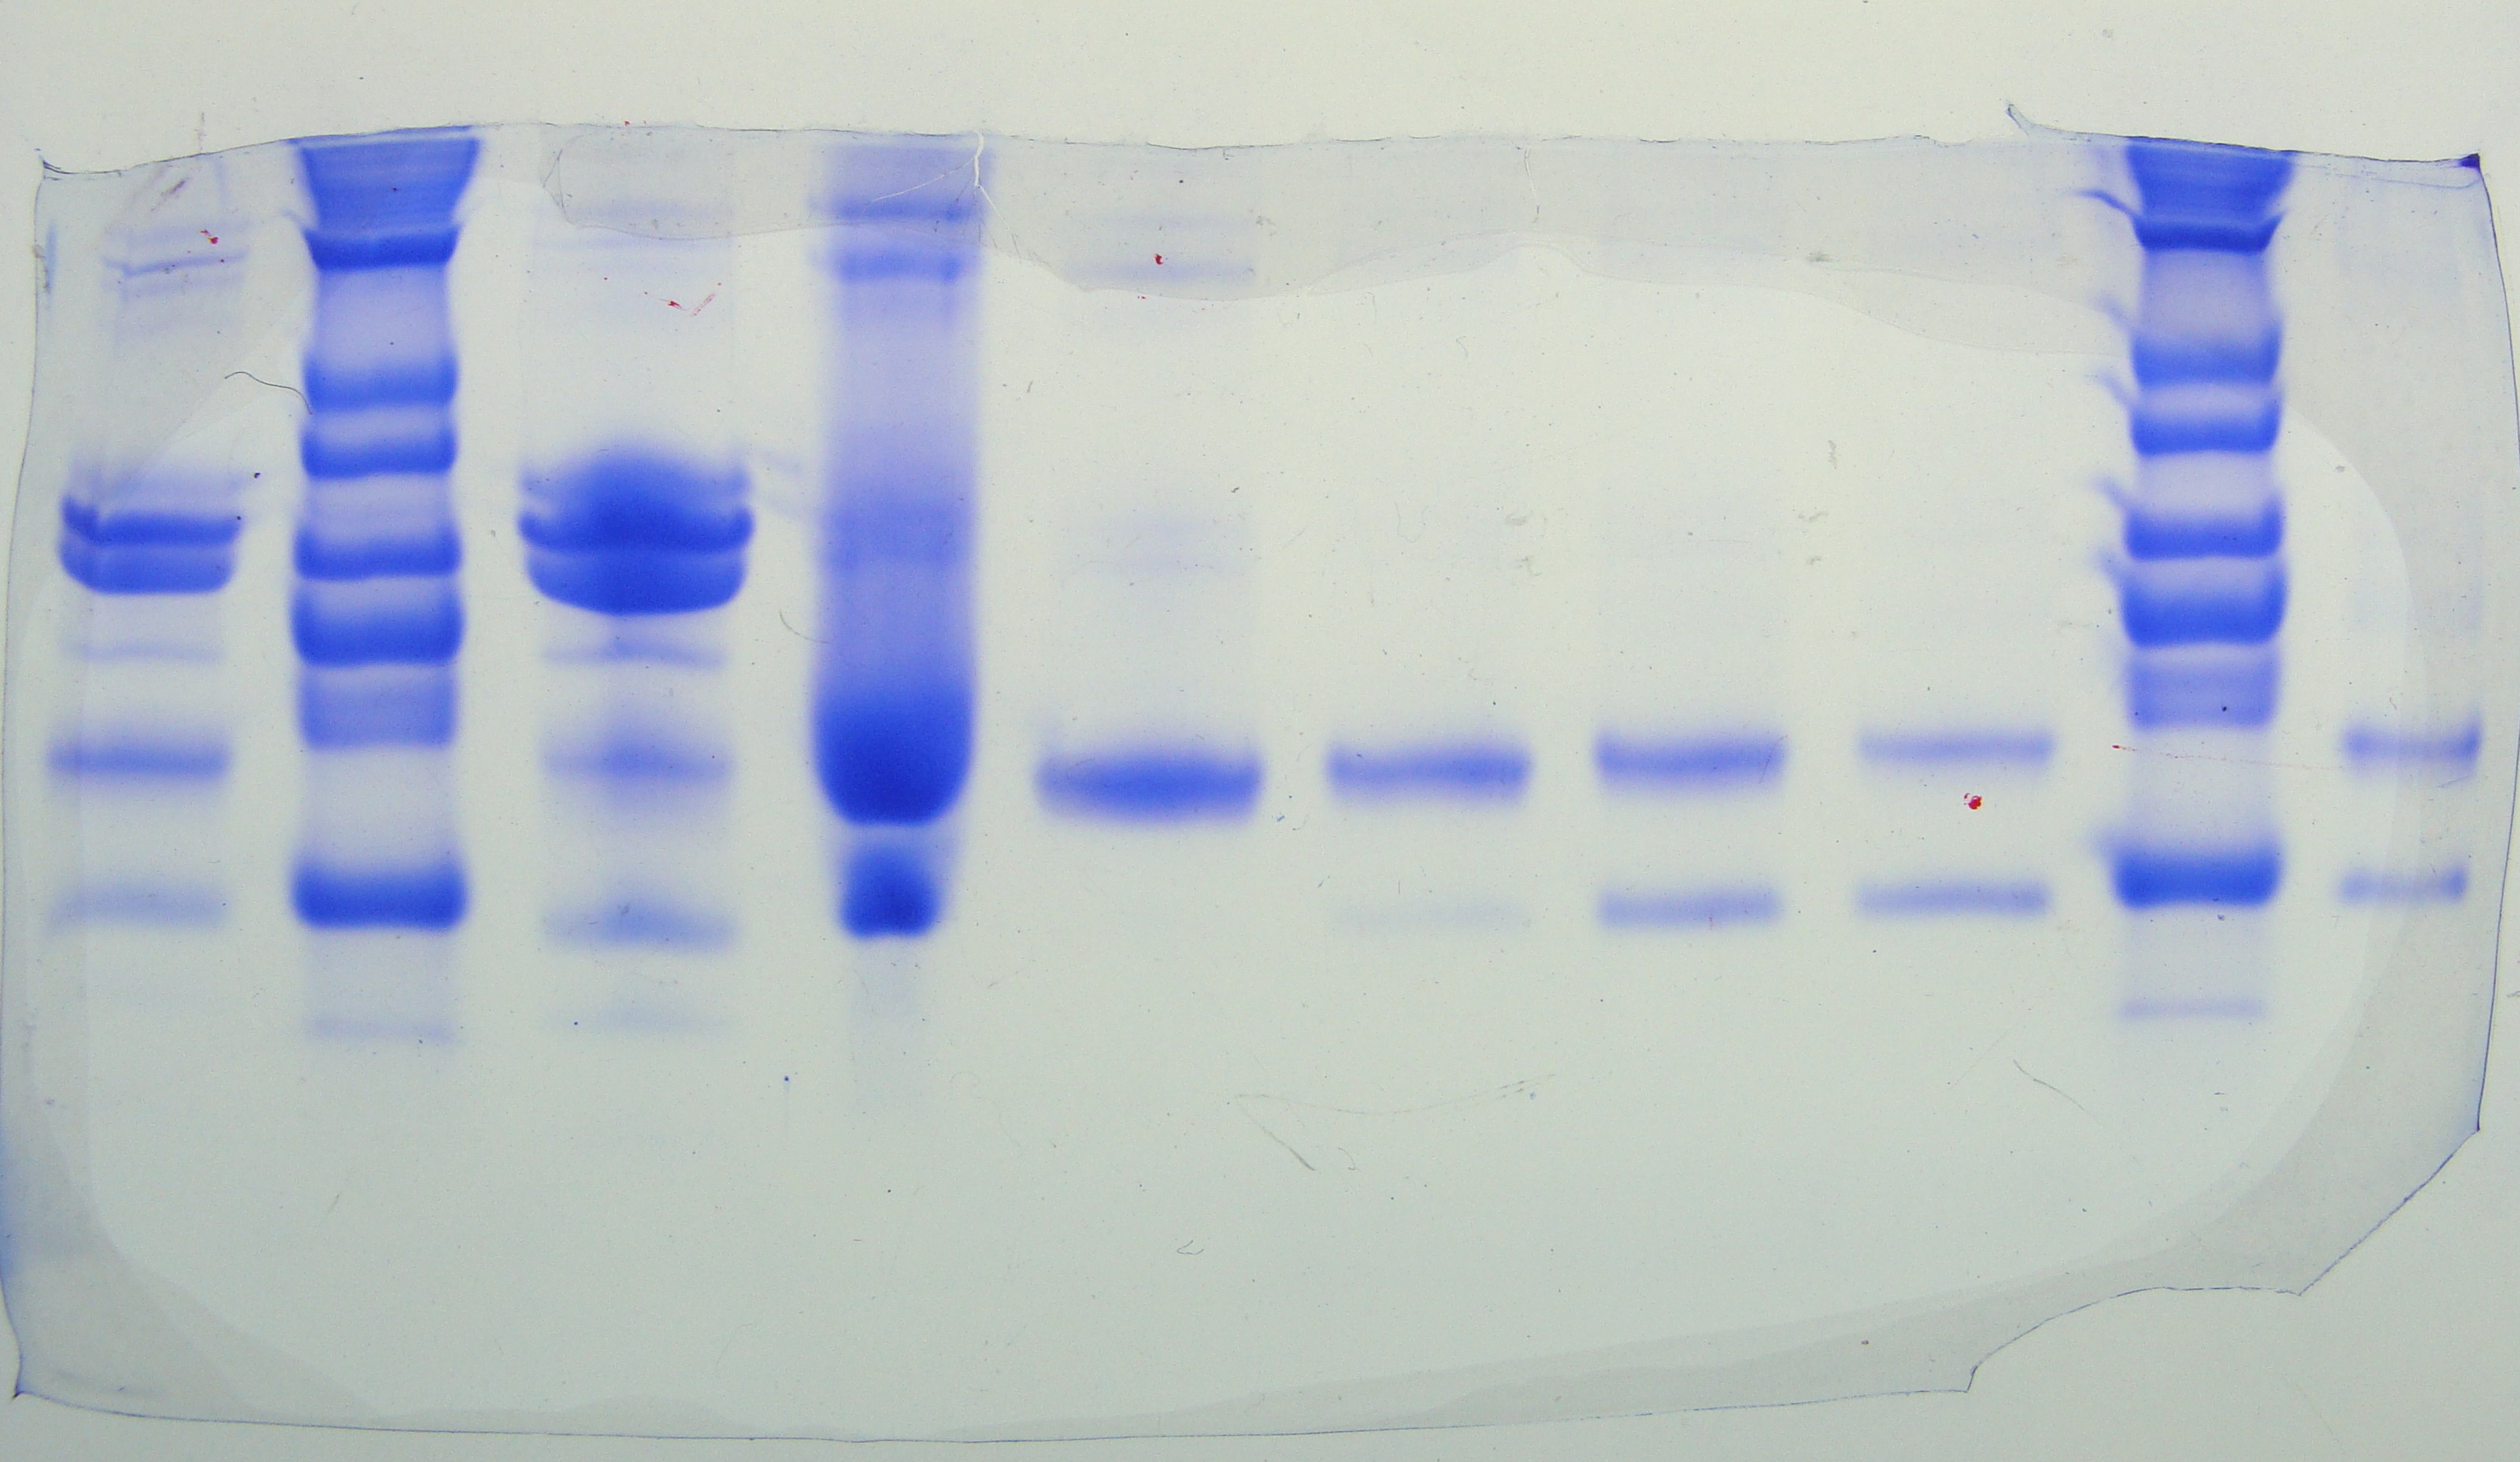
Separation of milk proteins using SDS-PAGE
BIOL 1406
PreLab 8d.1
How can you analyze your SDS-PAGE gel in
order to determine the effectiveness of your purification procedure?
In Lab 8a, you collected 8 milk fractions while purifying
α-lactalbumin:
nonfat milk, pellet, whey, and 5 column chromatography fractions. In Lab 8b, you
used the Bradford's assay to determine the protein concentration of each milk
fraction. In Lab 8c,
you used gel electrophoresis to separate the different proteins present in each
milk fraction. In this lab, you will analyze your gel in order to
assess the effectiveness of the various purification steps.
Because gel electrophoresis separates the proteins present in each
milk fraction into separate bands, counting the number of bands in each lane of
your gel will allow you to determine the number of different proteins present in each milk
fraction. Furthermore, you can estimate the relative concentrations of the
various proteins based on how dark or light each band is.
The higher the concentration of a particular protein, the darker its band will
be.
|
|
In addition, when the SDS-coated proteins travel through the gel during SDS-PAGE, their rate of movement toward the anode is determined almost entirely by size. Because there is a linear relationship between the log of the molecular weight of each protein and its migration distance, SDS-PAGE can be used to estimate the molecular weight of each protein based on its migration distance. In order to do this, a standard curve that shows the relationship between the migration distance through the gel and the log of molecular weight must be generated. The standard curve is generated by measuring the migration distance of several proteins of known molecular weight (MW standards), plotting a scatter diagram of migration distance vs. log of MW, and then using linear regression to determine the equation of the “best fit” straight line for the data points. Once this is done, you can substitute the migration distance of any protein on your gel into the linear regression equation and then calculate the log of MW for that protein. Knowledge of molecular weights can then be used to help identify the various proteins present in each fraction. |
|
Separation of milk proteins using SDS-PAGE |
| Your Turn | |
| How can you determine the number of
proteins that are present in each milk fraction that was saved during the
purification of α-lactalbumin?
|
Check your answer. |
| How can you estimate the relative
concentrations of the various proteins in each milk fraction?
|
Check your answer. |
| How can you prepare a standard curve that
shows the relationship between the migration distance of a protein through
your electrophoresis gel and the log of its molecular weight?
|
Check your answer. |
| If you know the migration distance through
your gel for an unknown protein, how can you determine its molecular weight?
|
Check your answer. |
| How will you try to identify the various
proteins that are present in each milk fraction?
|
Check your answer. |
Close this browser window to return
to Blackboard and complete the practice quiz and assessment quiz.