|
To help you
learn the features of Excel required for this class, 3 Excel quizzes have
been posted on the Internet. As part of this prelab section, you must complete Excel Quiz 1 and Excel Quiz 2. After you have completed each quiz, save your spreadsheet and then send an email to your instructor with the spreadsheets from both quizzes attached. Links to the quizzes are provided below.
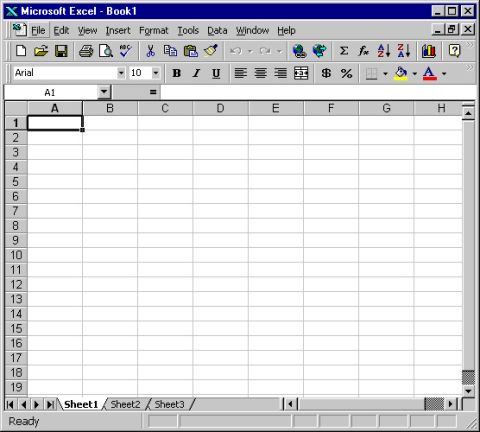
Excel Quiz 1 describes the basic features of Excel and explains how to
enter data into a table (or spreadsheet) made up of horizontal rows and vertical
columns. Excel Quiz 1 also explains how to enter formulas into your spreadsheet.
You can find another description of how to enter data into an Excel spreadsheet
in Appendix B at the end of this lab manual.
Excel Quiz 1 for Excel 2007 (use this link if you plan to use Excel 2007 - recommended)
Excel Quiz 1 for Excel 97- 2003 (use this link if you plan to use an earlier version of Excel)
Excel Quiz 2 explains how to use Excel to calculate statistics such as
mean, percent error of the mean, and standard deviation. It also describes the
Student’s t-test and explains how to use Excel to carry out the Student’s
t-test. You can find another description of how to calculate mean and standard
deviation with Excel in Appendix B at the end of this lab manual.
Excel Quiz 2 for Excel 2007 (use this link if you plan to use Excel 2007 - recommended)
Excel Quiz 2 for Excel 97- 2003 (use this link if you plan to use an earlier version of Excel)
Remember to send an email to your instructor with the spreadsheets from both quizzes attached!!!
|
